Monitoring a Microservices System on ECS

This article was translated from Spanish using AI. The original, written by the author, is here: https://ghost.joel-uzcategui.com/monitorizacion-de-sistema-de-microservicios-en-ecs/
In this article I am going to show how to monitor a microservices project running on AWS ECS. It is not that simple, because Prometheus needs to know where the microservice it will take the metrics from actually is, and when a new deployment happens the microservices come up on another instance with a different IP. So the solution is not as easy as adding a static IP to the configuration file prometheus.yml.
To solve this problem I use an OpenTelemetry component that helps me discover where the new containers are. To see the solution, we are going to monitor a restaurant table booking project.
The project
It is a restaurant table booking system made up of four NestJS services that talk to each other over RabbitMQ.
- reservations-api: The entry point of the system. The user talks to it over HTTP, and it talks to the rest of the microservices through a RabbitMQ queue
- booking-worker: The one that does the work of booking tables. It looks for a free table in that time slot and creates the reservation
- occupancy-stats: A service that delivers information, such as "how many tables are still free at 21:00?"
- no-show-sweeper: A garbage collector. Nobody calls it, but it does an important job: when someone starts a reservation the table is locked to avoid double bookings for the same table in the same slot, and this service periodically checks which reservations were left orphaned in order to invalidate them and release the table
The infrastructure
                          internet
                              │
                      ┌───────▼───────┐
                      │      ALB      │  :80
                      └───────┬───────┘
                              │ :8080
  ┌───────────────────────────┼─────────────────────────────┐
  │  VPC                      │                             │
  │                           │                             │
  │                  ┌────────▼─────────┐                   │
  │                  │ Task A           │                   │
  │                  │  reservations-api│  :8080  :9090     │
  │                  └──────────────────┘         ▲         │
  │                                               │         │
  │                  ┌──────────────────┐         │         │
  │                  │ Task B           │         │         │
  │                  │  booking-worker  │  :9091  │         │
  │                  │  occupancy-stats │  :9092  │         │
  │                  │  no-show-sweeper │  :9093  │         │
  │                  └──────────────────┘    ▲    │         │
  │                                          │    │         │
  │                       scrape 9090-9093   │    │         │
  │                  ┌───────────────────────┴────┴───┐     │
  │                  │  EC2                           │     │
  │                  │   OTel Collector               │     │
  │                  │   Prometheus                   │     │
  │                  │   Grafana                      │     │
  │                  └────────────────────────────────┘     │
  │                                                         │
  └─────────────────────────────────────────────────────────┘
Traffic comes in through the ALB, which forwards it to reservations-api, which handles the request and makes the calls it needs to the other microservices.
On the monitoring side we need a VPC holding the EC2 instance with all the machinery for monitoring.
- Grafana: To visualise the metrics
- Prometheus: To collect the metrics
- OTel Collector: To discover the new container IPs on every deployment
A static Prometheus configuration
# prometheus.yml
scrape_configs:
  - job_name: reservations-api
    static_configs:
      - targets: ['10.20.2.98:9090']

  - job_name: booking-worker
    static_configs:
      - targets: ['10.20.2.113:9091']

  - job_name: occupancy-stats
    static_configs:
      - targets: ['10.20.2.113:9092']
This is a static Prometheus configuration. As we can see in the value of the label targets there is an IP with a port: that is where Prometheus is told which IP and which port to take the metrics from. However, a new deployment on ECS changes those addresses, and from Prometheus it would look like a broken microservice.
What it looks like with autodiscovery
# prometheus.yml
scrape_configs:
  - job_name: tablebook-ecs

    file_sd_configs:
      - files:
          - /etc/prometheus/targets/ecs_sd_targets.yaml
        refresh_interval: 15s

    relabel_configs:
      - source_labels: [prometheus_job]
        target_label: job
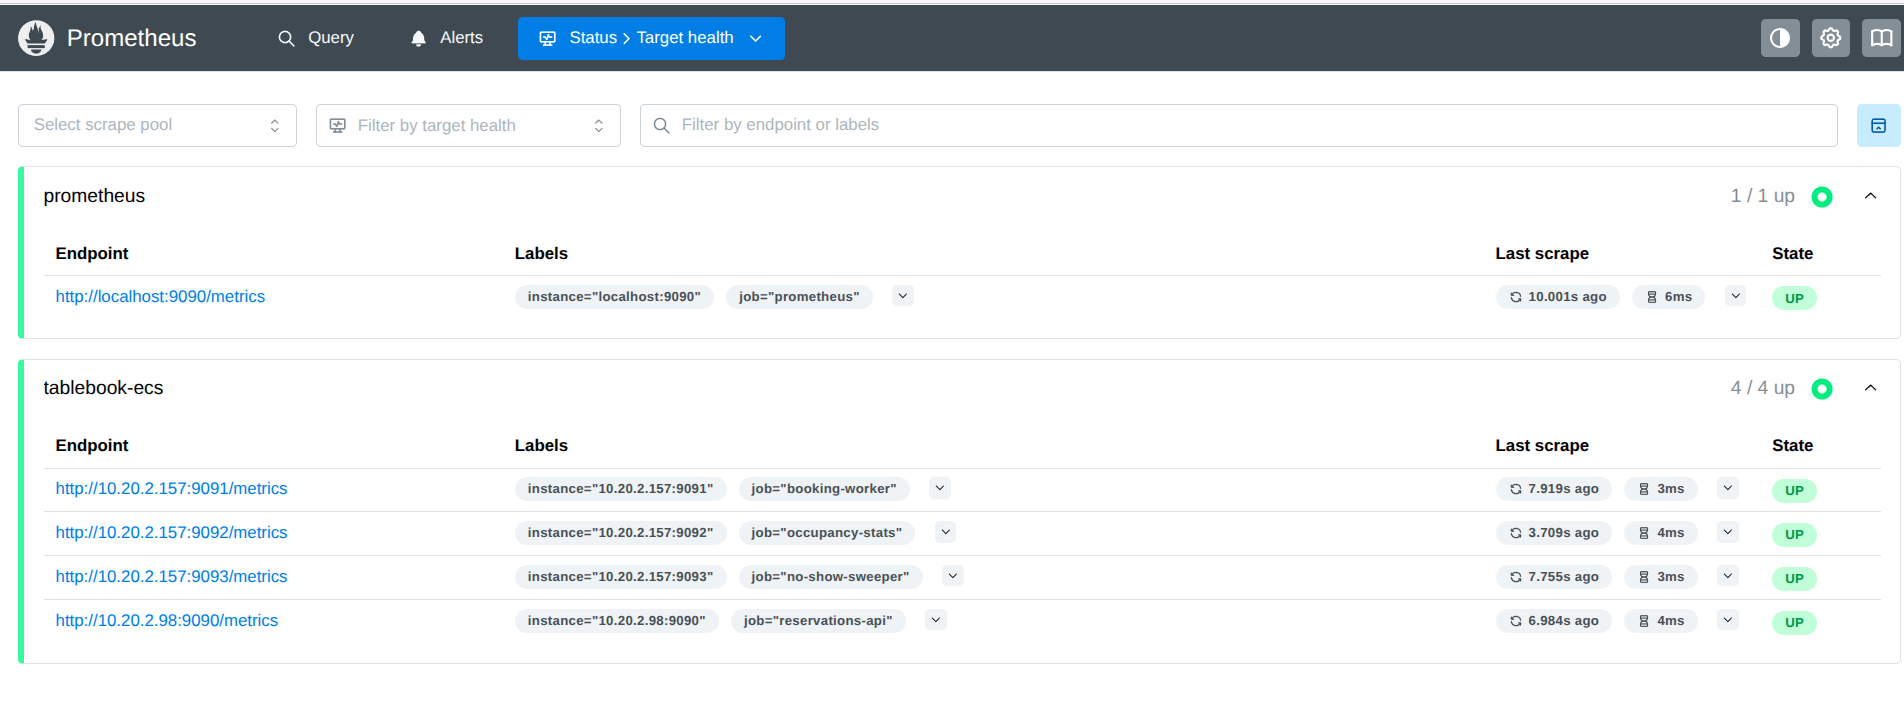
This file works differently. Here Prometheus reads its targets from a file that the OTel Collector keeps up to date, so that Prometheus knows where to read the metrics from. The targets file looks like this:
# ecs_sd_targets.yaml — written by the collector, not edited by hand
- targets:
    - 10.20.2.157:9091
  labels:
    __meta_ecs_cluster_name: tablebook
    __meta_ecs_container_name: booking-worker
    __meta_ecs_task_definition_family: tablebook-workers
    __meta_ecs_task_definition_revision: "2"
    __meta_ecs_task_launch_type: FARGATE
    __metrics_path__: /metrics
    prometheus_job: booking-worker

- targets:
    - 10.20.2.157:9092
  labels:
    __meta_ecs_container_name: occupancy-stats
    __metrics_path__: /metrics
    prometheus_job: occupancy-stats
Docker labels on the ECS tasks
So that the OTel Collector can tell which microservices expose metrics, I add the following docker labels to the container definition inside the ECS task. I also set up the port mapping so that each container exposes its metrics on a different port.
{
  "name": "booking-worker",
  "image": "...",
  "portMappings": [{ "containerPort": 9091 }],
  "dockerLabels": {
    "PROMETHEUS_EXPORTER_PORT": "9091",
    "PROMETHEUS_EXPORTER_PATH": "/metrics",
    "PROMETHEUS_EXPORTER_JOB_NAME": "booking-worker"
  }
}
These label names are my own definitions, that is, they are not names reserved by Prometheus, Grafana or the OTel Collector. They are names I chose, and they have to match both in the OTel configuration and in the ECS task definition. This is how the OTel configuration looks
# otel-config.yaml
docker_labels:
  - port_label: PROMETHEUS_EXPORTER_PORT
    metrics_path_label: PROMETHEUS_EXPORTER_PATH
    job_name_label: PROMETHEUS_EXPORTER_JOB_NAME
A different port per service
An important detail is that, even though we have different containers, they all share the same IP. That is why each container needs a different port, and why it is also important to set the security group rules so that the EC2 instance can reach the container ports on ECS.
Bringing the monitoring up with Docker Compose
On the EC2 machine, everything lives in one folder:
/opt/monitoring/
├── docker-compose.yml
├── otel-config.yaml            collector configuration
├── prometheus.yml              Prometheus configuration
└── targets/                    ← the collector writes here
    └── ecs_sd_targets.yaml        and Prometheus reads from here
The Compose paths are relative to that folder, so it is enough to go into
it and bring everything up:
cd /opt/monitoring
docker compose up -d
The three pieces run as containers:
# docker-compose.yml
services:
  otel-collector:
    image: otel/opentelemetry-collector-contrib:latest
    user: '65534:65534'
    command: ['--config=/etc/otel/config.yaml']
    volumes:
      - ./otel-config.yaml:/etc/otel/config.yaml:ro
      - ./targets:/etc/targets
    environment:
      - AWS_REGION=us-east-1
    restart: unless-stopped

  prometheus:
    image: prom/prometheus:latest
    command:
      - '--config.file=/etc/prometheus/prometheus.yml'
      - '--storage.tsdb.path=/prometheus'
    volumes:
      - ./prometheus.yml:/etc/prometheus/prometheus.yml:ro
      - ./targets:/etc/prometheus/targets:ro
      - prometheus-data:/prometheus
    ports:
      - '9090:9090'
    restart: unless-stopped

  grafana:
    image: grafana/grafana:latest
    ports:
      - '3000:3000'
    restart: unless-stopped

volumes:
  prometheus-data:
From this Docker Compose it is worth pointing out the volume shared between the OTel Collector and Prometheus: ./targets:/etc/targets and ./targets:/etc/prometheus/targets:ro. Note that Prometheus mounts it read-only while OTel mounts it with write permission, because OTel writes and Prometheus only needs to read.
And the collector's user: '65534:65534' is not a security detail. The Prometheus image runs as that user, so the collector has to write the file as the same one, or Prometheus will not be able to read it.
Also, the ./targets directory on the machine has to belong to that
user before starting:
mkdir -p targets && sudo chown 65534:65534 targets
The collector configuration
# otel-config.yaml
extensions:
  ecs_observer:
    cluster_name: tablebook
    cluster_region: us-east-1
    result_file: /etc/targets/ecs_sd_targets.yaml
    refresh_interval: 15s
    job_label_name: prometheus_job

    docker_labels:
      - port_label: PROMETHEUS_EXPORTER_PORT
        metrics_path_label: PROMETHEUS_EXPORTER_PATH
        job_name_label: PROMETHEUS_EXPORTER_JOB_NAME

receivers:
  nop:

exporters:
  nop:

service:
  extensions: [ecs_observer]
  pipelines:
    metrics:
      receivers: [nop]
      exporters: [nop]
The docker_labels block is where the circle closes: they are the same names
we put in the task definition.
Permissions for the EC2 instance
The collector queries the ECS API, so the machine needs permission
to do it. With an instance role and this policy:
{
  "Effect": "Allow",
  "Action": [
    "ecs:ListTasks",
    "ecs:DescribeTasks",
    "ecs:ListServices",
    "ecs:DescribeServices",
    "ecs:DescribeTaskDefinition",
    "ecs:DescribeContainerInstances",
    "ec2:DescribeInstances"
  ],
  "Resource": "*"
}
You can find more about me and my work at joel-uzcategui.com